Backwardation or Contango?
Personal Finance & Money Asked on May 10, 2021
I was looking for graphs of backwardation and contango but I’ve found seemingly contradictory image results:
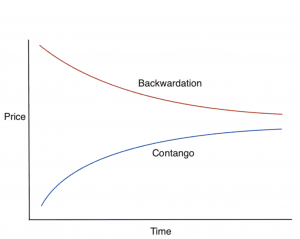
For instance this image and this one show contago on top, but this one shows it on the bottom.
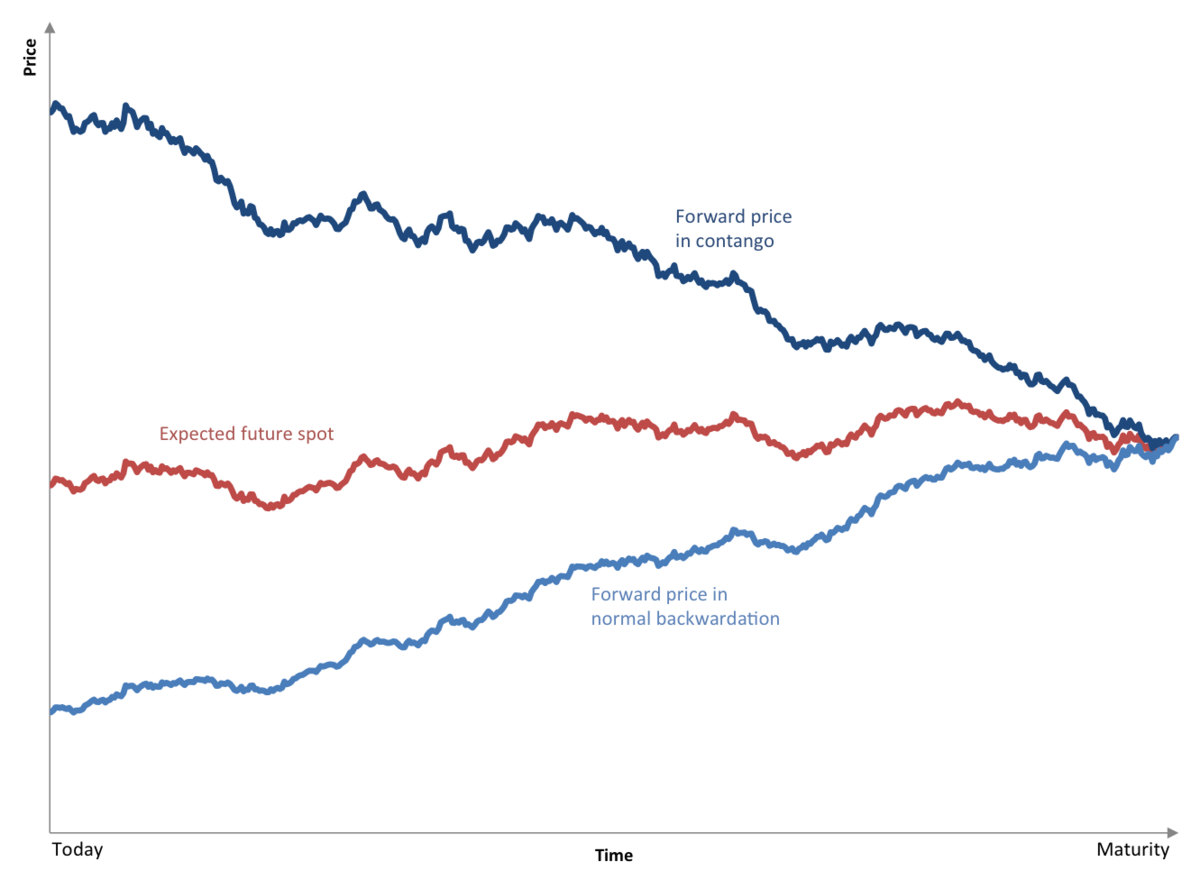
Then there’s this graph which makes it even more confusing by widening the spread nearer to maturity which makes no sense. Is the y-axis always a spot price, an expected future price, or a contract price?
Could somebody help explain this? I’m trying to understand both. During the 2020 oil crash, when investors were worried about carrying costs / delivery, and the price went to zero, was this backwardation and which graph above would apply?

2 Answers
Is the y-axis always a spot price, an expected future price, or a contract price?
The y axis is not always any one of those. Typically the x-axis is a maturity date and the y-axis is the price of the futures that expire at that date, but some of these graphs use different axes values that make it confusing.
The basic definition of Backwardation is when the futures price is below the current spot price (technically the expected spot price at that time, but that's only different by the cost of carry - to make it simpler we're ignoring that). Visually a backwardated forward curve (price vs expiry) starts at the current spot price and is downward sloping.
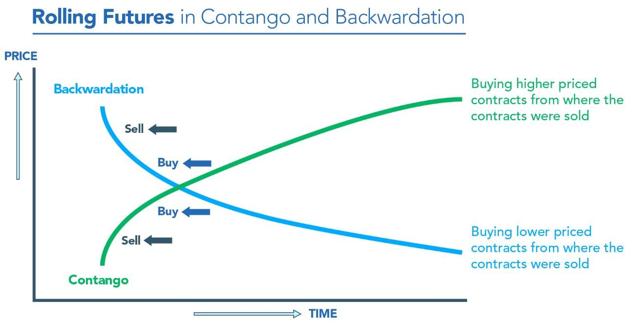
What some of these graphs is trying to illustrate (poorly in my opinion) is the change over time of a backwardated futures price. If a futures price is below the current spot, the expected behavior is for the futures price to rise until it meets the spot price. I say expected in the sense that if the commodity future is significantly cheaper, then investors will "buy" the futures, bringing its price up. So the price of a backwardated futures is expected to rise over time, which is what the 2nd and 3rd charts are intending to show.
The last graph is essentially the same as the first, but they chose to have the futures cross instead of converge at the end.
Correct answer by D Stanley on May 10, 2021
From Investopedia's definition of contango:
Contango is a situation where the futures price of a commodity is higher than the spot price... That results in an upward sloping forward curve.
So contango occurs when futures prices are above current spot prices and the futures curve has a positive slope.

What's confusing is the concept of normal contango and normal backwardation which describes the future curve's position against the expected future spot price. I believe some of the charts you posted are attempting to describe this concept, but for your purposes I would use the chart I posted.
As for where the slope is located, I wouldn't worry about that so much, since it just describes the level of the futures price and not if it is in backwardation or contango. When examples of backwardation and contango are presented on the same chart, you might find it helpful to envision each curve referring to a different asset, as one asset can only have one futures curve (barring the existence of multiple markets, etc.).
Answered by Flatley on May 10, 2021
Add your own answers!
Ask a Question
Get help from others!
Recent Questions
- How can I transform graph image into a tikzpicture LaTeX code?
- How Do I Get The Ifruit App Off Of Gta 5 / Grand Theft Auto 5
- Iv’e designed a space elevator using a series of lasers. do you know anybody i could submit the designs too that could manufacture the concept and put it to use
- Need help finding a book. Female OP protagonist, magic
- Why is the WWF pending games (“Your turn”) area replaced w/ a column of “Bonus & Reward”gift boxes?
Recent Answers
- Peter Machado on Why fry rice before boiling?
- Lex on Does Google Analytics track 404 page responses as valid page views?
- Joshua Engel on Why fry rice before boiling?
- haakon.io on Why fry rice before boiling?
- Jon Church on Why fry rice before boiling?